A case study in measuring, and fixing, table extraction accuracy across a real, diverse document corpus.
A PDF has no concept of a table. It only knows where individual characters sit on a page. Every extraction tool has to reconstruct rows, columns, and cell boundaries from nothing but character positions, and the gap between what looks like a table to a human eye and what a piece of software can reliably detect turns out to be a lot wider than it seems from the outside.
If you've ever tried to pull a table out of a PDF, you already know the results are unpredictable. Sometimes it works perfectly. Sometimes every row collapses into one line. Sometimes you get a table that doesn't exist at all, built from a form's outline or a chart's axis lines rather than any real tabular data. We wanted to know, precisely, how often each of these actually happens, and why, rather than relying on the impression that things generally seem to work.
This is a case study, not an industry comparison. We tested our own two table-extraction tools, PDF to Excel and Extract Tables, against a 20-file corpus of real, publicly sourced documents, using a scoring method we're publishing here in full, formulas, thresholds, and all. We are not claiming this represents every PDF tool on the market, and we haven't tested any competing product against this corpus. We're showing our own work, including the parts that didn't go well and the parts that still don't, so the numbers can actually be checked and trusted rather than taken on faith.
Key Findings
Our first benchmark run scored 10.41% content accuracy on Extract Tables. After expanding the test corpus and fixing the root cause, it settled at 83.76%, and hasn't moved since.
That fix was not a chart-detection feature. It was a single validation gate that stops the tool from writing every rectangle and colon-terminated line to a spreadsheet as if it were a table.
17 of 20 files in our test corpus score a perfect 1.0 on both content and structure accuracy.
Every file in the Laws & Regulations category scored 97.8% or higher. It's the cleanest category we tested.
Scientific articles are the hardest category by far, ranging from 10% to 100% accuracy depending on whether the page contains a chart.
The single lowest score in our entire corpus, 10%, comes from one specific failure mode: text belonging to a chart (axis labels, legend entries) gets correctly classified as "not a table," but nothing yet recognizes it as chart furniture that should be discarded.
Content accuracy and structure accuracy are measured as two separate, independent scores. A table with every value correct but in the wrong cell would score well on one and poorly on the other.
Our ground truth data is hand-verified against the actual PDF, not against the tool's own output. We learned why this matters the hard way: an unverified test once scored 100% by comparing our OCR output to itself, before hand-verification corrected it to the real number, 17%.
Three files in our current results still aren't perfect: one genuine miss and two false positives. That's honest, not hidden.
The numbers in this report were last verified on July 30, 2026. A later code change touches the same shared logic and hasn't been re-benchmarked against the full corpus yet.
The Corpus
All 20 scored files come from DocLayNet v1.2, a real-world document layout dataset built from real financial reports, government tenders, laws and regulations, and scientific articles. Five files per category, twenty files total, fetched directly from the dataset rather than hand-picked to flatter any particular result. Every file went through the same pipeline, the same scoring, and the same hand-verification process described below.
A note on citation: DocLayNet's per-page identifiers don't expose original document titles, only category labels, so individual files in the scored set aren't citable by name or source document. The dataset itself is publicly available on Hugging Face as ds4sd/DocLayNet-v1.2, and anyone can reproduce the same category composition against it.
The corpus directory also holds three additional files that are not part of the headline numbers in this report, worth naming so nothing is quietly excluded without explanation. One is a real, publicly citable EPA letter, used separately for OCR testing rather than table scoring. Another is a hand-cropped fixture from an academic paper on table extraction methods, used as a single-file stress test for scanned, low-resolution tables, covered in detail later in this report. The third has never been scored at all, no ground truth exists for it yet.
Why we didn't test competitors
This report deliberately doesn't include Adobe, Smallpdf, iLovePDF, or any other PDF tool run against the same corpus. That would make for a stronger, more citable piece of research, and it's an honest limitation worth naming rather than glossing over. What we can offer instead is full transparency into our own numbers, including where they came from, how they were checked, and where they're still wrong, which is more than most single-vendor benchmark claims typically provide.
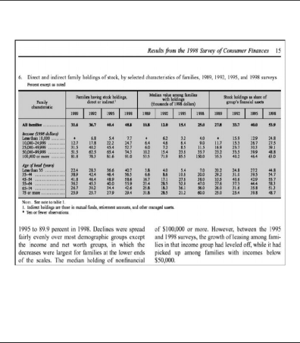 A financial report table. Clean borders, consistent numeric columns, five-survey-year structure. Every file in categories like this scored close to 100%. | 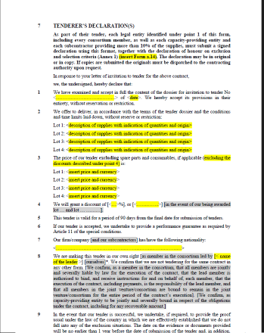 A government tender declaration. Numbered clauses, several ending in a colon followed by a value ('Lot 1:', bracketed fields). This is the exact shape of content the pre-gate key-value heuristic used to misread as a table. |
How We Measured Accuracy
Every table extraction was scored two separate, independent ways. A tool can do well on one and poorly on the other, and we think both numbers matter.
Content accuracy (content F1)
This measures whether the right text ended up in the output at all, regardless of position. We compare the extracted cells and the ground-truth cells as two unordered multisets of text, then compute precision, recall, and F1 from the overlap.
def grid_cells(grid):
    """Multiset of non-empty normalized cell texts."""
    counts = Counter()
    for row in normalize_grid(grid):
        for cell in row:
            if cell:
                counts[cell] += 1
    return counts

matched = sum((ground_truth & predicted).values())
precision = matched / total_predicted
recall = matched / total_ground_truth
f1 = 2 precision recall / (precision + recall)
A table extracted with every cell present but scrambled into the wrong row and column order still scores a perfect 1.0 on this metric. That's intentional. This metric answers one question only: did we get the right content?
Structure accuracy (structure F1)
This measures whether cells ended up in the correct position relative to each other, using the same adjacency-relation approach as the ICDAR table recognition benchmark. Every non-empty cell forms a relation with its nearest non-empty neighbor to the right, and its nearest non-empty neighbor below. We compare those relation pairs the same way as content, as multisets, scored for precision, recall, and F1.
Because relations are defined by adjacency rather than absolute position, a whole table shifted down the page still scores 1.0. But a wrong column split, a merged row, or cells in the wrong order breaks the specific pairs and shows up directly in the score.
How ground truth was established
This part matters more than it might seem. Ground truth starts as a draft: we run the current pipeline over a real PDF and save its own output as a starting point, explicitly marked unverified. A person then opens the source PDF and the draft side by side and hand-corrects every cell before marking it verified. Nothing is scored against an unverified draft.
We learned why this distinction is critical from a real mistake. Early in scanned-PDF testing, one file scored a perfect 100% on both content and structure accuracy. That result was meaningless: the draft ground truth had been generated by the same OCR pipeline being tested, so the tool was being compared against its own output. Once a person manually verified the actual text against the source scan, the real score came back at 17%, revealing a genuine OCR accuracy ceiling on dense, small text that the circular test had completely hidden.
The Headline Number, Explained
The progression itself is worth walking through step by step, because it's a genuinely useful finding on its own: a narrow test corpus doesn't tell you much, and a bigger, more diverse one changes the picture substantially.
Two things happened on the way from 10% to 84%, and both mattered. The test corpus grew from 5 files, financial reports only, to a full, diverse 20-file set spanning four document categories. And a validation gate was added to the extraction pipeline. Separating the two shows what each one actually contributed.
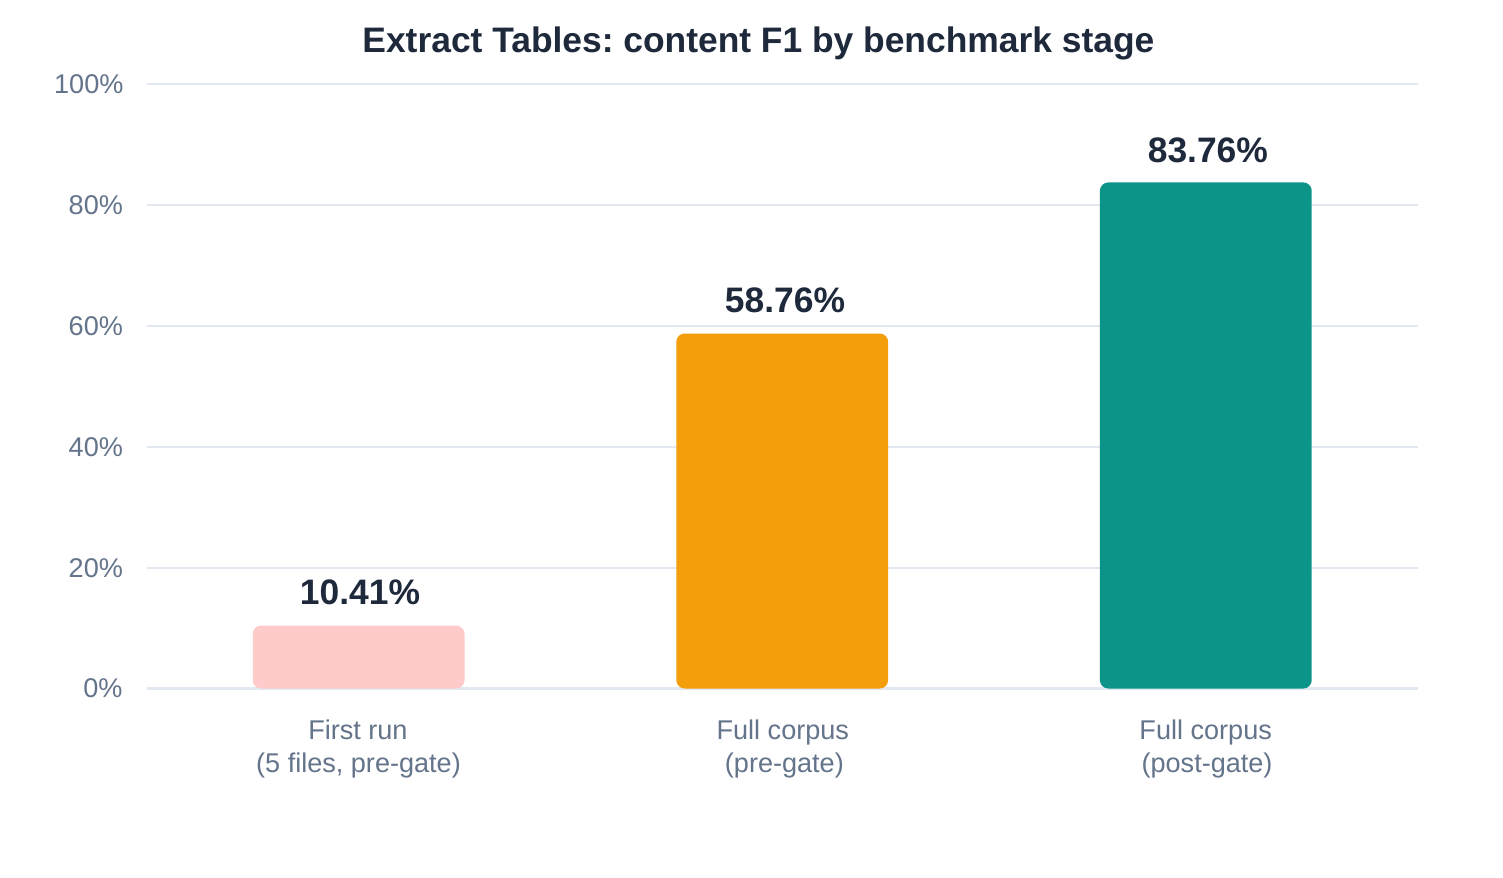
Figure 1: Extract Tables' content accuracy across three points in the benchmark's history.
The middle bar isolates the gate's real effect: on the exact same 20-file corpus, adding the validation check moved content accuracy from 58.76% to 83.76%. The first bar shows our actual first-ever run, a smaller, easier corpus of financial reports only, and it scored 10.41%, which is really a lesson about test design more than about the pipeline: a narrow corpus understates how a system will perform once it meets real variety.
How the Pipeline Decides What It's Looking At
Before any table gets extracted, every page has to be classified. This runs first, and it determines which extraction method gets applied to the rest of the page.
A page is classified as bordered if it has at least two horizontal and two vertical vector lines, or at least three filled rectangles, the kind of ruled grid a genuine bordered table draws. If neither condition holds, the pipeline falls back to a density-based check: words are projected onto a 40-bin histogram across the page width, and the largest empty run of at least two bins in the middle half of the page becomes a candidate column gap. No gap found means the page is classified as plain text.
If a gap is found, one more check decides between two remaining page types. Words are grouped into lines using a vertical tolerance scaled to the page's own median word height, and for every line with two or more words, the pipeline checks whether that line's words straddle the gap on both sides. If more than half of multi-word lines do, the page is classified as stream, a borderless table where rows genuinely span both sides of the column gap. Otherwise it's classified as columnar, independent parallel lists that never actually interact, the kind of layout a two-column article uses and that should never be read as a table at all.
What the fix actually was
The problem wasn't a missing capability. It was that two separate extraction paths trusted their own output blindly, and both are worth describing precisely rather than in the abstract, since the specific failure modes are more instructive than a general description.
The first: a vector chart's axis box and gridlines register as ordinary rectangles on the page, the same kind of rectangle a real bordered table uses to draw its borders. Before the fix, any detected rectangle grid was written to a spreadsheet as a table, which meant a chart's axis lines and legend entries became their own fake table, complete with garbage cell contents pulled from whatever text happened to sit near those lines.
The second: any line of text ending in a colon was treated as the key half of a key-value pair, a reasonable heuristic for a genuine form field, but a broken one for ordinary prose. On a page containing a small real table plus normal paragraph text, headings and questions ending in a colon were being forced into a fake key-value grid alongside the real data, and if most of the resulting "pairs" had no real value on the other side, that was a strong signal the whole thing was misclassified prose, not a form.
The fix is a single validation function, applied identically to every extraction path, whether the candidate table came from Camelot's lattice or stream mode, a rectangle-detected grid, or the pipeline's own zone-based word extraction, before anything is accepted as a real table:
def is_tabular(grid):
    if len(grid) < 2:
        return False  # need at least 2 rows
    if looks_like_numbered_list(grid):
        return False
    ncols = max(len(row) for row in grid)
    if ncols < 2:
        return False  # need at least 2 columns
    multi_cell_rows = sum(1 for row in grid if count_nonempty(row) >= 2)
    if multi_cell_rows / len(grid) < 0.5:
        return False  # most rows need 2+ real values
    cells = [c for row in grid for c in row if c.strip()]
    numeric_fraction = sum(1 for c in cells if looks_numeric(c)) / len(cells)
    avg_length = sum(len(c) for c in cells) / len(cells)
    return numeric_fraction >= 0.2 or avg_length <= 30
A candidate grid that fails this check isn't discarded, it's demoted to plain text instead, which is exactly what a chart's axis numbers or a paragraph with one colon in it actually are. There's also a narrower, separate guard against a different false positive: a short grid, three rows or fewer, two columns or fewer, where every first-column cell is a bare numeric marker like "25." or "(3)" with nothing else in it, gets rejected as a stray list-index fragment rather than a table. That guard is deliberately scoped tight, so a genuine short table whose first column happens to carry real reference numbers is unaffected, only a first column made up entirely of bare index markers triggers the rejection.The Geometry Layer
Underneath the four classification phases sits a shared layer of geometric logic that both PDF to Excel and Extract Tables rely on. This is where most of the actual precision comes from, and it's worth walking through in detail because each piece exists to fix a specific, real failure mode observed during development, not as a theoretical nicety.
Finding the column gap
Splitting a borderless page into columns isn't as simple as finding the widest empty strip. A table's own gap between a label and its value can be wider than the true gutter between two unrelated content columns, so picking the widest gap can pick the wrong one entirely.
Instead, the pipeline ranks candidate gaps by balance, how evenly a given split point divides the page's actual text extent, not by raw width:
def balance(gx):
    left_span = gx - x_lo
    right_span = x_hi - gx
    return min(left_span, right_span) / max(left_span, right_span)

gap_x = max(candidates, key=balance)
Candidates come from a 120-bin occupancy histogram built from full word extents, not just word midpoints, across the middle half of the page. A run of low-occupancy bins only qualifies as a candidate gutter if it's also wider than a minimum threshold, and that minimum is itself adaptive: never less than 8 points, never more than 14, scaled to three times the page's own median word spacing, so a page set in a larger font doesn't generate false gutters purely from its own normal word spacing.
One more guard exists specifically for a wide label-and-value table that geometrically resembles two columns but isn't. If one side of a candidate split is overwhelmingly numeric and the other is overwhelmingly text, the split is rejected, since two genuine layout columns tend to be mixed content on both sides, not cleanly numeric on one and textual on the other. The split is also rejected if more than a third of lines physically straddle the gutter, which usually means a full-width title or paragraph is being misread as two columns, or if either side has fewer than five words to work with.
A more recent addition catches a subtler case: a table whose columns each repeat the same wrapped, non-numeric header text, for example a label like "Families having stock holding, direct or indirect" printed once above every year-column in a multi-year comparison table. Geometrically this looks exactly like two genuine content columns, since both sides open with real text rather than numbers, so the numeric-asymmetry guard doesn't catch it. A dedicated check compares the opening text on each side using the same fuzzy string-matching approach used for cross-page header detection, described below, and rejects the split if both sides start with a close enough match.
Grouping words into lines
Words are clustered into lines by the vertical center of each glyph, not its top or bottom edge. This choice fixes two specific, real problems. Bold or larger-font words sitting on the same visual line as smaller text have a higher top edge, which would otherwise pull them into a separate line if top-alignment were used. Footnote markers and characters with descenders shift the bottom edge in ways that don't reflect where the text actually sits on the line. Center-based grouping is unaffected by either.
The clustering itself chains words in sorted order rather than bucketing them into fixed intervals, specifically to avoid a failure mode where two words within tolerance of each other end up split across a bucket boundary purely due to where the boundary happens to fall. The tolerance itself is scaled to 40% of the page's median word height, clamped between 2 and 8 points, so it adapts to the page's actual type size rather than using one fixed number across every document.
Removing dot leaders
A dot leader, the row of dots connecting a label like "Section" to a value like "12" in a table of contents, physically fills the whitespace that column-gap detection relies on to find a gutter. Left in place, a leader can defeat gap detection entirely by making a genuine column boundary look occupied.
These are stripped at the word level, before any geometry runs, using a pattern that only matches three or more consecutive dots, deliberately excluding real decimal points and single ellipsis characters from being caught by the same rule. A word containing a leader run gets split into its real text segments, with each segment's position re-interpolated from the original word's average character width, and a word that's pure leader characters is dropped entirely.
Stitching tables across a page break
A table that continues onto a second page shouldn't become two separate outputs. Two consecutive tables on adjacent pages are merged into one when they share the same column count and their header rows match closely enough, using fuzzy string comparison per cell, averaged across the row, with a match threshold that treats headers as equivalent, so "Week No." and "Week Number" are correctly recognized as the same column even though the text isn't identical. This same threshold and comparison method is used in three separate places in the pipeline: cross-page header matching for both extraction paths, and the repeated-header-column guard described above, all independently implemented rather than sharing one function, but tuned to the same standard throughout.
Full Results
All 20 files, both tools, both metrics. Rows highlighted are the current genuine imperfections, one real miss and two false positives, none of which are hidden from this total.
Category | PDF to Excel content F1 | PDF to Excel structure F1 | Extract Tables content F1 | Extract Tables structure F1 | |
1 | Financial reports | 98.3% | 92.0% | 100% | 100% |
2 | Financial reports | 82.6% | 71.4% | 79.8% | 70.2% |
3 | Financial reports | 93.1% | 82.1% | 100% | 100% |
4 | Financial reports | 95.7% | 93.7% | 95.5% | 94.6% |
5 | Financial reports | 96.7% | 88.9% | 100% | 100% |
6 | Government tenders | 66.7% | 55.1% | 0.0% (miss) | 0.0% |
7 | Government tenders | 98.6% | 100% | 100% | 100% |
8 | Government tenders | 91.5% | 79.5% | 100% | 100% |
9 | Government tenders | 87.3% | 86.2% | 0.0% (false pos.) | 0.0% |
10 | Government tenders | 83.1% | 71.4% | 100% | 100% |
11 | Laws & regulations | 100% | 100% | 100% | 100% |
12 | Laws & regulations | 100% | 100% | 100% | 100% |
13 | Laws & regulations | 100% | 98.9% | 100% | 100% |
14 | Laws & regulations | 100% | 97.8% | 100% | 100% |
15 | Laws & regulations | 100% | 100% | 100% | 100% |
16 | Scientific articles | 51.6% | 37.2% | 100% | 100% |
17 | Scientific articles | 10.0% (lowest) | 0.0% | 100% | 100% |
18 | Scientific articles | 35.3% | 30.0% | 100% | 100% |
19 | Scientific articles | 100% | 100% | 100% | 100% |
20 | Scientific articles | 85.7% | 88.2% | 0.0% (false pos.) | 0.0% |
Table 1: Per-file results, full 20-file corpus. Both tools scored against the same hand-verified ground truth.
Accuracy by Document Category
Averaged across the corpus, PDF to Excel and Extract Tables land at 83.81% and 83.76% content accuracy respectively, both structure accuracy scores sit close behind. But that average hides a wide, real spread once you break it down by document type.
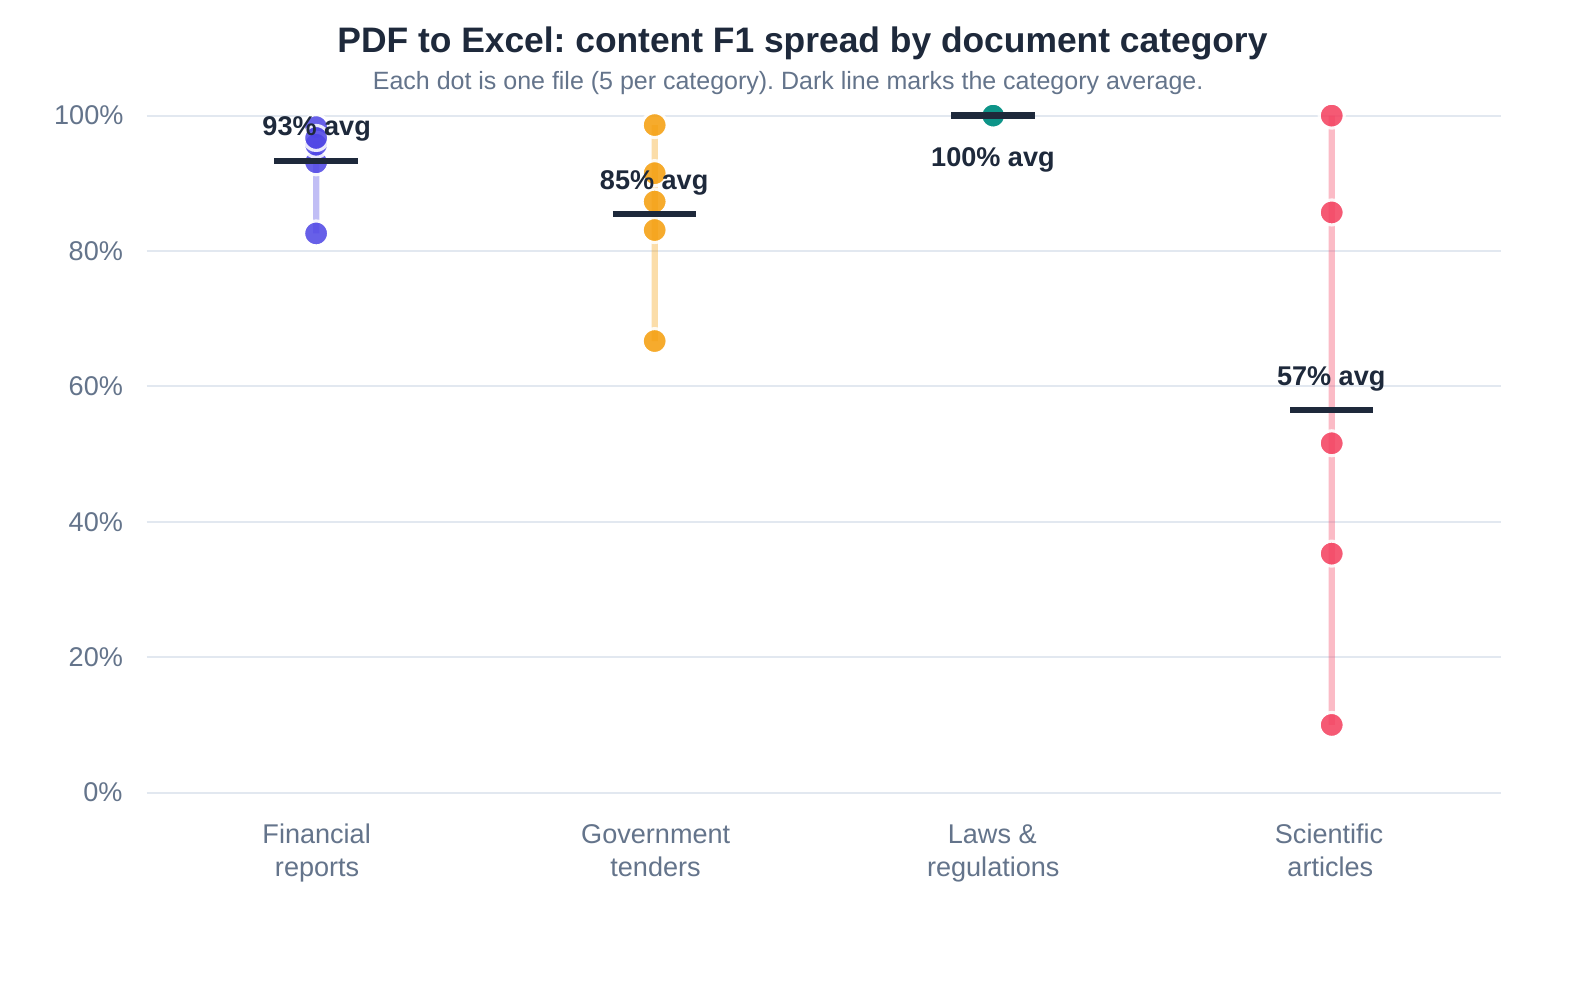
Figure 2: PDF to Excel content accuracy, individual files and category averages.
Laws & regulations is the cleanest category we tested, every file scored 97.8% or above on both tools. These documents tend to use simple, well-bordered tables with little competing visual noise.
Scientific articles is the hardest category, and by a wide margin, ranging from a perfect 100% down to the single lowest score in the whole corpus, 10%. The difference isn't the subject matter, it's whether the specific page contains a chart. One scientific article file scored a perfect 100% despite being in the worst-performing category overall, which tells us the failure mode is chart-specific, not a blanket penalty against dense academic writing.
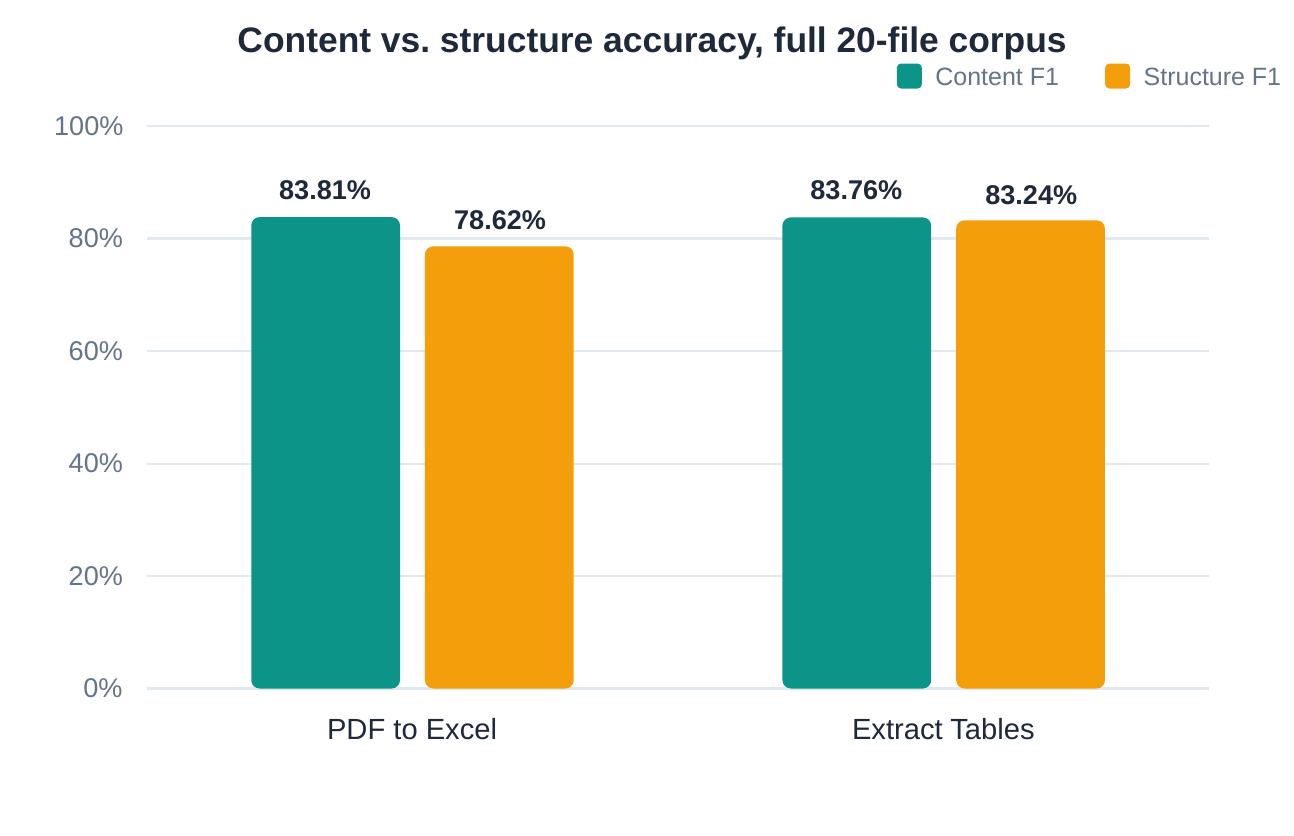
Figure 3: Content vs. structure accuracy, averaged across the full corpus, both tools.
Why the Mean and the Median Tell Different Stories
PDF to Excel's 20-file mean is 83.81%, but its median is 94.36%, an 10.5-point gap. That gap is driven almost entirely by three files, all in the scientific articles category, scoring 10.0%, 35.3%, and 51.6%. Remove those three and the remaining 17 files average in the mid-90s individually.
We're reporting both numbers rather than picking whichever looks better, because they answer different questions. The median tells you what a typical document experiences. The mean tells you what happens once genuinely hard documents, chart-heavy pages and dense mathematical notation, enter the mix. Both are true at the same time.
Scanned PDFs
The scored 20-file corpus contains no scanned documents, every DocLayNet page has a native text layer. Scanned-PDF support exists and is shipped separately, with one benchmarked data point worth walking through in full, because the result itself is a lesson in why hand-verified ground truth matters.
We tested a single scanned, deliberately low-resolution (640px width) table, cropped from an academic paper specifically to stress-test OCR quality. The first scoring run against this file came back at a perfect 100% content and structure accuracy. That number was meaningless: the ground truth it was scored against was an unverified draft, generated by running the same OCR pipeline being tested and treating its own output as correct. It was circular by construction.
Once a person manually verified the true text directly against the scanned image, the real score came back at 17.16% content accuracy and 5.77% structure accuracy, almost entirely explained by OCR misreading dense, small numeric text at that resolution, not by the table-extraction logic itself. The extraction also over-fragmented the table, splitting it into more pieces than actually existed.
We don't have enough scanned test cases yet to state a general relationship between scan resolution and accuracy as a proven trend. What we do have is one clear, documented case showing that relationship exists, and a firm rule going forward: no result gets published until it's checked against hand-verified truth, not a tool's own output.
How scanned-PDF support actually works
OCR support shipped after this benchmark's classifier gate, in two separate stages worth distinguishing. The first added automatic OCR as a fallback: every page's extractable text layer is checked, and any page falling under a minimum character threshold triggers OCR that masks existing text regions and recognizes only the image content underneath, rather than an all-or-nothing decision applied to the whole document. A document with some native-text pages and some scanned pages gets OCR applied only where it's actually needed.
The second addition fixed a gap that only shows up on scanned bordered tables specifically. The bordered-page classification described earlier only sees vector lines and rectangles, and OCR never creates those, it recognizes and embeds text, not the ruled gridlines a scanner captured as part of the page image. That meant a scanned table with real, visible ruled borders was invisible to the normal bordered-page path even after OCR had added a usable text layer on top of it. The fix adds a fallback that runs image-based grid detection, which finds borders by analyzing the rendered page image directly rather than relying on vector objects, and this fallback only runs for documents that already went through OCR.
What's Still Broken
We'd rather say this plainly than let someone find out the hard way.
Chart leakage
This is the direct cause of the single lowest score in our corpus. A chart's axis numbers and legend entries are correctly recognized as not being a table, which stops them from becoming a fake spreadsheet grid. But nothing yet recognizes that this text belongs to a chart specifically and should be dropped entirely, keeping only the caption below it. On our worst-performing file, this produced nine separate stray text fragments pulled from one chart, including raw axis tick labels and an axis title, none of which should have appeared in the output at all. There's currently no mechanism anywhere in the pipeline that clusters a chart's vector lines and curves into a bounding region and excludes text inside it, this is a real, identified gap, not a partial fix. It's the single biggest thing we're actively working on.
The three files that still aren't perfect
Even in the current, improved state, three of twenty files in our corpus aren't perfect, and we'd rather describe each one specifically than fold them into a vague caveat.
One government tender file has a real table that was missed entirely, by every extraction path tried. Ground truth confirms exactly one table exists on that page; the pipeline produced zero. This is a genuine detection failure, not a scoring artifact.
Two other files, one government tender and one scientific article, produced the opposite problem: a table detected where the ground truth contains none at all. Both are false positives on prose or form content that passed every current guard, including the classifier gate described above, which tells us that gate, while it fixed the large majority of false positives, doesn't catch every case.
Together these three files don't move the overall average much, seventeen of twenty files score a perfect 1.0 on both metrics, but they're real, current, and unresolved, and we're naming them specifically rather than letting a strong aggregate number imply a cleaner result than what actually exists.
Dense mathematical and academic notation
Two files in our corpus, both scientific articles with heavy mathematical notation, scored 35.3% and 51.6% respectively, and these two exact files are what the "35 to 52 percent" range for this category actually refers to, not an estimate. This is a genuinely different layout problem from charts, dense equations and specialized notation break the geometric assumptions the extraction pipeline relies on, spacing, alignment, and column structure all behave differently in mathematical typesetting than in an ordinary table. If your document is a math-heavy research paper, expect a rougher result than a financial statement.
Other known gaps, not yet independently re-verified against current code
Beyond the issues above, a working list of further improvements exists that hasn't landed yet: repairing column-type coherence within a table, handling spanning header cells that merge across multiple columns in the output, stripping footnote markers that currently pollute cell content, a second cross-page merge signal based on column-boundary geometry rather than header text (to catch tables whose header only prints on the first page), quality gating based on Camelot's own internal parsing confidence report, an adaptive retry using a different line-detection scale when the first attempt looks poor, splitting right-aligned or merged currency columns that occasionally get read as one value, and locale-aware number parsing, the current pipeline only handles US and UK decimal conventions, not the comma-as-decimal format common in much of continental Europe.
A Note on When This Was Measured
Precision here matters as much as the numbers themselves. The results in this report were last verified on July 30, 2026, against the pipeline as it existed at that time. One code change since then touches the same shared classification logic used by both tools, and the full corpus has not been re-benchmarked against it as of publishing. We expect these numbers to hold, but that's an expectation, not a re-measured fact, and we'd rather say so than imply a currency we haven't actually verified.
We'll update this report if a full re-run produces a materially different result.
Try It Yourself
Extract Tables and PDF to Excel are both free, with no account required for a single file. If you want to see how either one handles your own document, upload it directly, no signup, and the file is deleted from our systems automatically after two hours.
We'd genuinely like to hear about the documents that don't come out clean. If you run into a table that breaks, that's exactly the kind of real-world case that helps us improve the pipeline described in this report.
Peter
Founder of PDFHaul and Bultech
Building tools that make working with documents faster and simpler.