


We built 20 PDFs with known answers and ran nine tools on them to find out which ones get a table into a spreadsheet correctly. Every output was checked cell by cell: 3,233 cells in all. Clean tables are easy. The differences show up with merged cells, tables over several pages and scanned pages. We make PDFHaul, so two of the nine tools are ours, and their misses are shown too.
In this post
10 findings from 3,233 cells
Clean tables with borders are a solved problem. Six of the seven tools that handle native files read every cell right. Excel was the exception, and all 16 of its misses were percentage cells that changed format.
Tables without borders split the field once. pdfplumber's default settings returned nothing (0 of 380 cells). Camelot, Tabula, iLovePDF and both PDFHaul tools read all 380. Excel read 364, missing only percentage cells.
On the 16 files that are not scanned, both PDFHaul tools and iLovePDF were right on every cell: 2,851 of 2,851.
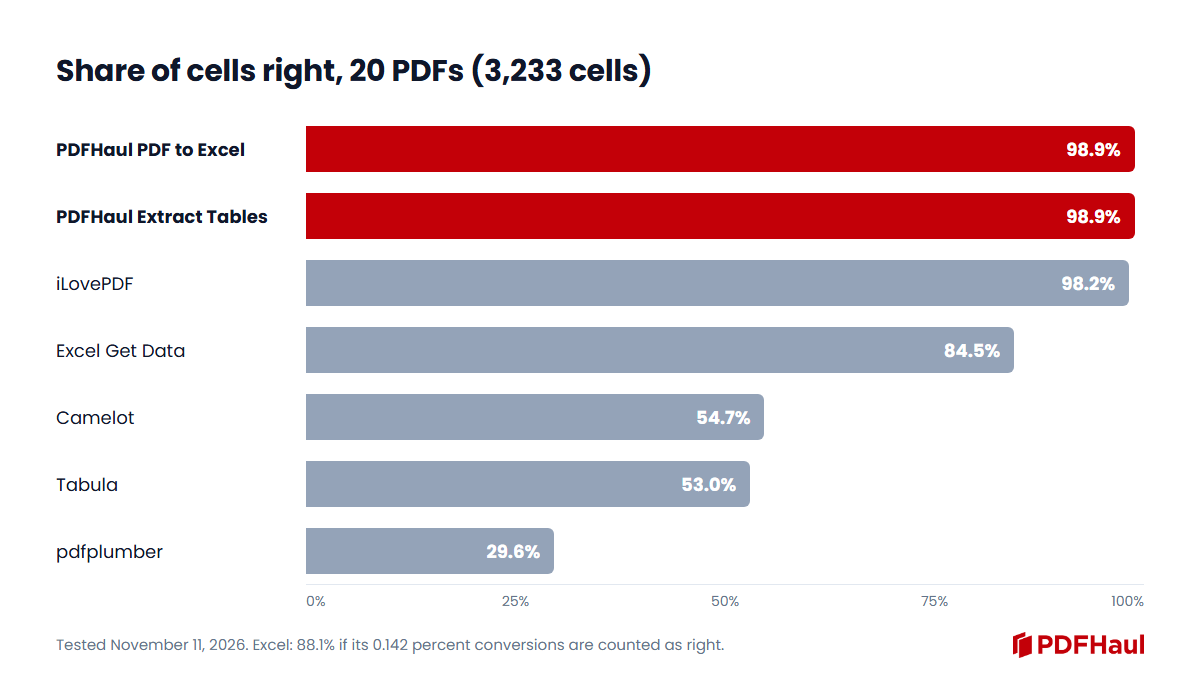
Overall, on all 20 files: PDFHaul 98.9%, iLovePDF 98.2%, Excel Get Data 84.5%, Camelot 54.7%, Tabula 53.0%, pdfplumber 29.6%.
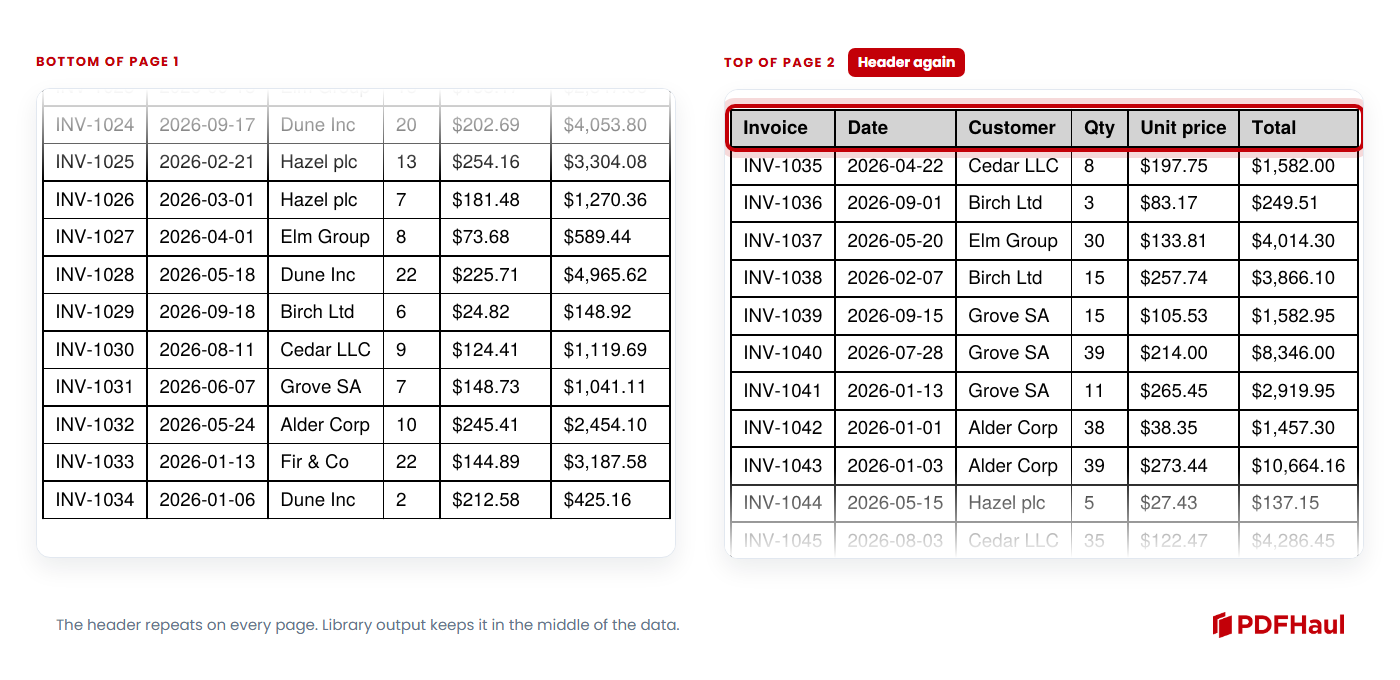
Multi-page tables trip the libraries. Camelot and Tabula scored 44.9% as delivered, because each page comes back as its own table with the header repeated. Stacked, with the repeated headers dropped, both reach 100%.
Scanned pages need OCR. Camelot, Tabula, pdfplumber and Excel read nothing from them. Smallpdf's free tier got 0 of 229 cells right on the two scans we could run through it.
Across the four scans, PDFHaul scored 90.3% and iLovePDF 84.6%.
On the two scans Adobe's free tier would convert, Adobe led: 94.8%, against 89.1% for iLovePDF and 83.8% for PDFHaul.
Every OCR tool made small mistakes that a glance misses: a 2 read as Z, a 0 read as O, a leading letter dropped from an ID, a decimal point moved.
Excel changed 117 percentage cells. It turned 14.2% into 0.142. Counted as wrong, Excel scores 84.5%. Counted as right, 88.1%, and 99.9% on the 16 files that are not scanned.
The 20 PDFs, the answer key, the scoring script and the raw results for every tool are in the download near the end of this post.
How we tested 20 PDFs and 3,233 cells
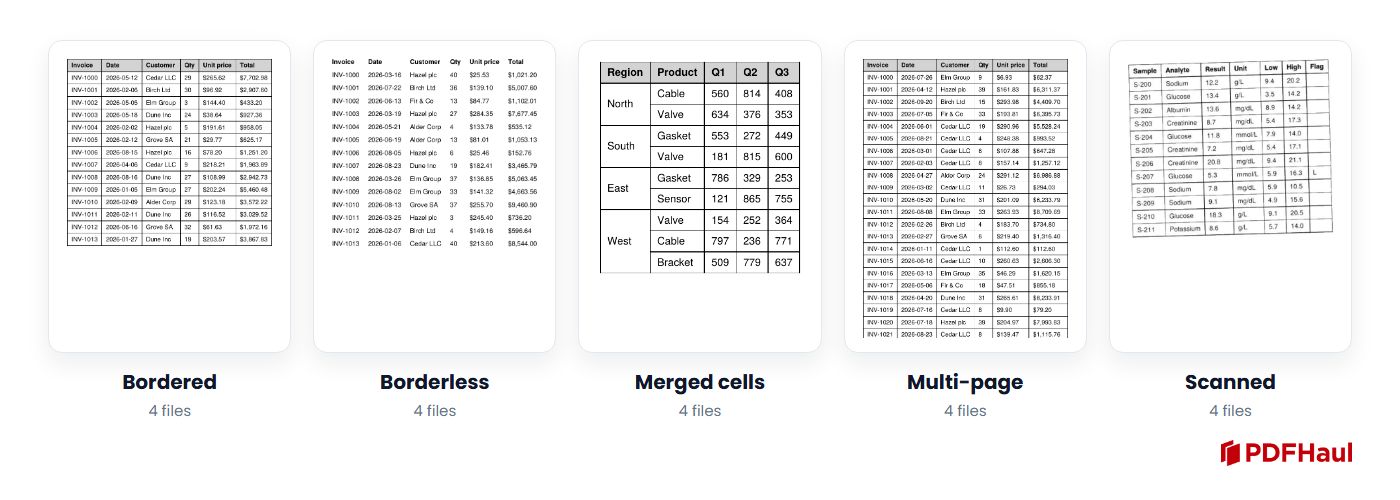
The files. There are 20 PDFs in five types, four files of each. All are synthetic, generated with known cell values, so there is no doubt about what the right answer is.
Bordered tables (4): one table with full grid lines.
Borderless tables (4): one table with no lines, only aligned columns.
Merged cells (4): region labels that span rows, a two-level header, a title row that spans columns.
Multi-page tables (4): one table over two or three pages, with the header row repeated on each page.
Scanned pages (4): the same kinds of table as images, with no text layer. One is clean, one has no borders, one is skewed, and one is dense.
The tools. The scope is tools that output a spreadsheet. We tested these nine, all on November 11, 2026:
PDFHaul PDF to Excel (puts the page content on one sheet)
PDFHaul Extract Tables (tables only, one sheet per table)
iLovePDF, free web version, with its OCR option off
Excel, Data, Get Data, From PDF (Microsoft 365 Apps for business, version 16.0.20527.20150, one query per PDF)
Camelot 1.0.9, default settings (lattice first, then stream if no table is found)
Tabula (tabula-py 2.10.0), default settings
pdfplumber 0.11.10, default table finder
Adobe Acrobat online, free version
Smallpdf, free version
The last two are limited by their free tiers. Adobe stopped after two conversions, so it was tested on the two hardest scanned files only. Smallpdf was tested on the same two files. Their results are shown separately and are not overall scores. Tools that output a Word or Google Docs document, such as PDF to Word, were left out because they produce documents, not spreadsheets.
How a cell is scored. A cell is right if its value matches the answer key. Numbers and dates match by value, so $18.09 and 18.09 count as the same. Percent-formatted cells are compared as displayed. The table can start anywhere in the output: title rows, blank rows and up to three blank leading columns are ignored, the same for every tool. For merged cells the value has to sit in the top-left cell of the merged region. Multi-page tables are scored as delivered and again with the repeated header rows removed.
The results: 98.9% at the top, 29.6% at the bottom
Share of cells right, as delivered, for the seven tools tested on all 20 files.
Tool | Bordered | Borderless | Merged | Multi-page | Scanned | All 20 files |
|---|---|---|---|---|---|---|
PDFHaul PDF to Excel | 100% | 100% | 100% | 100% | 90.3% | 98.9% |
PDFHaul Extract Tables | 100% | 100% | 100% | 100% | 90.3% | 98.9% |
iLovePDF (free) | 100% | 100% | 100% | 100% | 84.6% | 98.2% |
Excel Get Data | 95.2% | 95.8% | 98.3% | 95.7% | 0% | 84.5% |
Camelot | 100% | 100% | 100% | 44.9% | 0% | 54.7% |
Tabula | 100% | 100% | 68.0% | 44.9% | 0% | 53.0% |
pdfplumber | 100% | 0% | 100% | 22.9% | 0% | 29.6% |
Multi-page, with the repeated header rows removed: Camelot and Tabula reach 100%, and pdfplumber reaches 51.0%. Excel's low scores on bordered, borderless and multi-page files come from one cause, explained in the section on percentages below.
Two tools were tested on the two hardest scanned files only, because of free-tier limits. For comparison, the table includes the two tools that were run on all 20 files.
Tool | Skewed scan (91 cells) | Dense scan (138 cells) | Both files |
|---|---|---|---|
Adobe Acrobat online (free) | 85 (93.4%) | 132 (95.7%) | 217 of 229 (94.8%) |
Smallpdf (free) | 0 | 0 | 0 of 229 |
iLovePDF (free) | 87 (95.6%) | 117 (84.8%) | 204 of 229 (89.1%) |
PDFHaul (both tools) | 72 (79.1%) | 120 (87.0%) | 192 of 229 (83.8%) |
Do not read the Adobe and Smallpdf rows as overall scores. They cover two files each.
Clean tables with borders: every tool got them right
Every tool that was fully tested read the four bordered tables with every cell right, apart from Excel's percentage cells (see below). If your PDF is a clean table with grid lines, the choice of tool will not decide your result.
Tables without borders: one tool returned nothing
With no lines to follow, tools have to work out the columns from the spacing. PDFHaul, iLovePDF, Camelot and Tabula got all 380 cells right. pdfplumber's default table finder returned nothing for these files and scored 0%. Excel read the tables correctly apart from the percentage cells.
Merged cells: where the tools started to differ
This type has the most variety: region labels that span several rows, a header with two levels, and a title row that spans every column.
PDFHaul, iLovePDF, Camelot and pdfplumber: 100% on all four files.
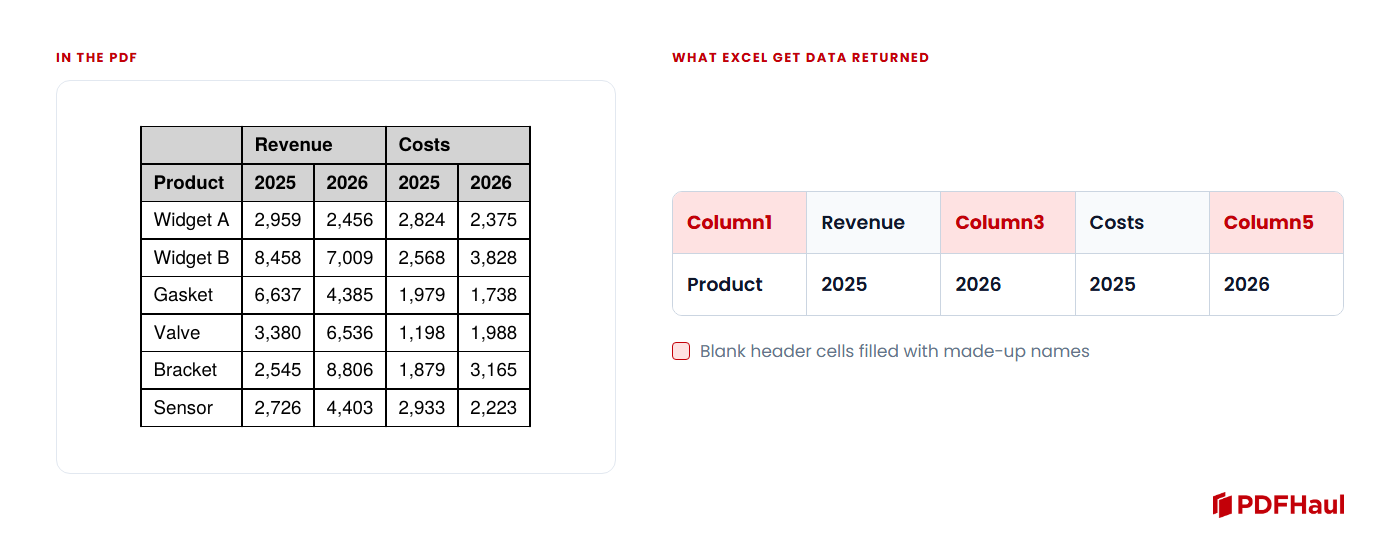
Excel: 98.3%. On the two-level header file it filled the cells that are blank in the PDF with its own placeholder names (Column1, Column3 and Column5), so 37 of 40 cells were right. The other three merged files were fully right.
Tabula: 68.0%. The file with a title row that spans every column was the worst case: Tabula put each whole row into a single cell and got one cell right out of 40.
Tables over several pages: the libraries leave the joining to you
A table that runs to a second and third page usually repeats its header row on each page. Camelot, Tabula and pdfplumber return one table per page, so the header shows up again in the middle of the data. Scored as delivered, Camelot and Tabula get 44.9% and pdfplumber gets 22.9%. Stacked into one table with the repeated headers dropped, Camelot and Tabula both reach 100%. The libraries read the cells fine. What they leave to you is joining the pages.
PDFHaul, iLovePDF and Excel delivered the pages as one continuous table, with no repeated header rows to remove, and scored the same with or without header removal.
Scanned pages: no tool got every cell
A scanned page is an image, so a tool needs OCR before it can find a table at all. Camelot, Tabula and pdfplumber read nothing from the four scanned files. Excel found no table: the Navigator showed "This table is empty". Smallpdf's free tier returned the scanned page as a picture inside an Excel sheet, with no values in any cell.
That leaves the tools with OCR:
File | PDFHaul (both tools) | iLovePDF | Adobe |
|---|---|---|---|
Clean bordered scan (78 cells) | 78 | 61 | not tested |
Borderless scan (75 cells) | 75 | 58 | not tested |
Skewed bordered scan (91 cells) | 72 | 87 | 85 |
Dense scan (138 cells) | 120 | 117 | 132 |
PDFHaul and iLovePDF were tested on all four. PDFHaul scored 345 of 382 cells (90.3%) and iLovePDF 323 of 382 (84.6%). On the clean and the borderless scan PDFHaul was perfect. On the two harder files the picture changes: Adobe was ahead on both, and iLovePDF was ahead of PDFHaul on the skewed scan.
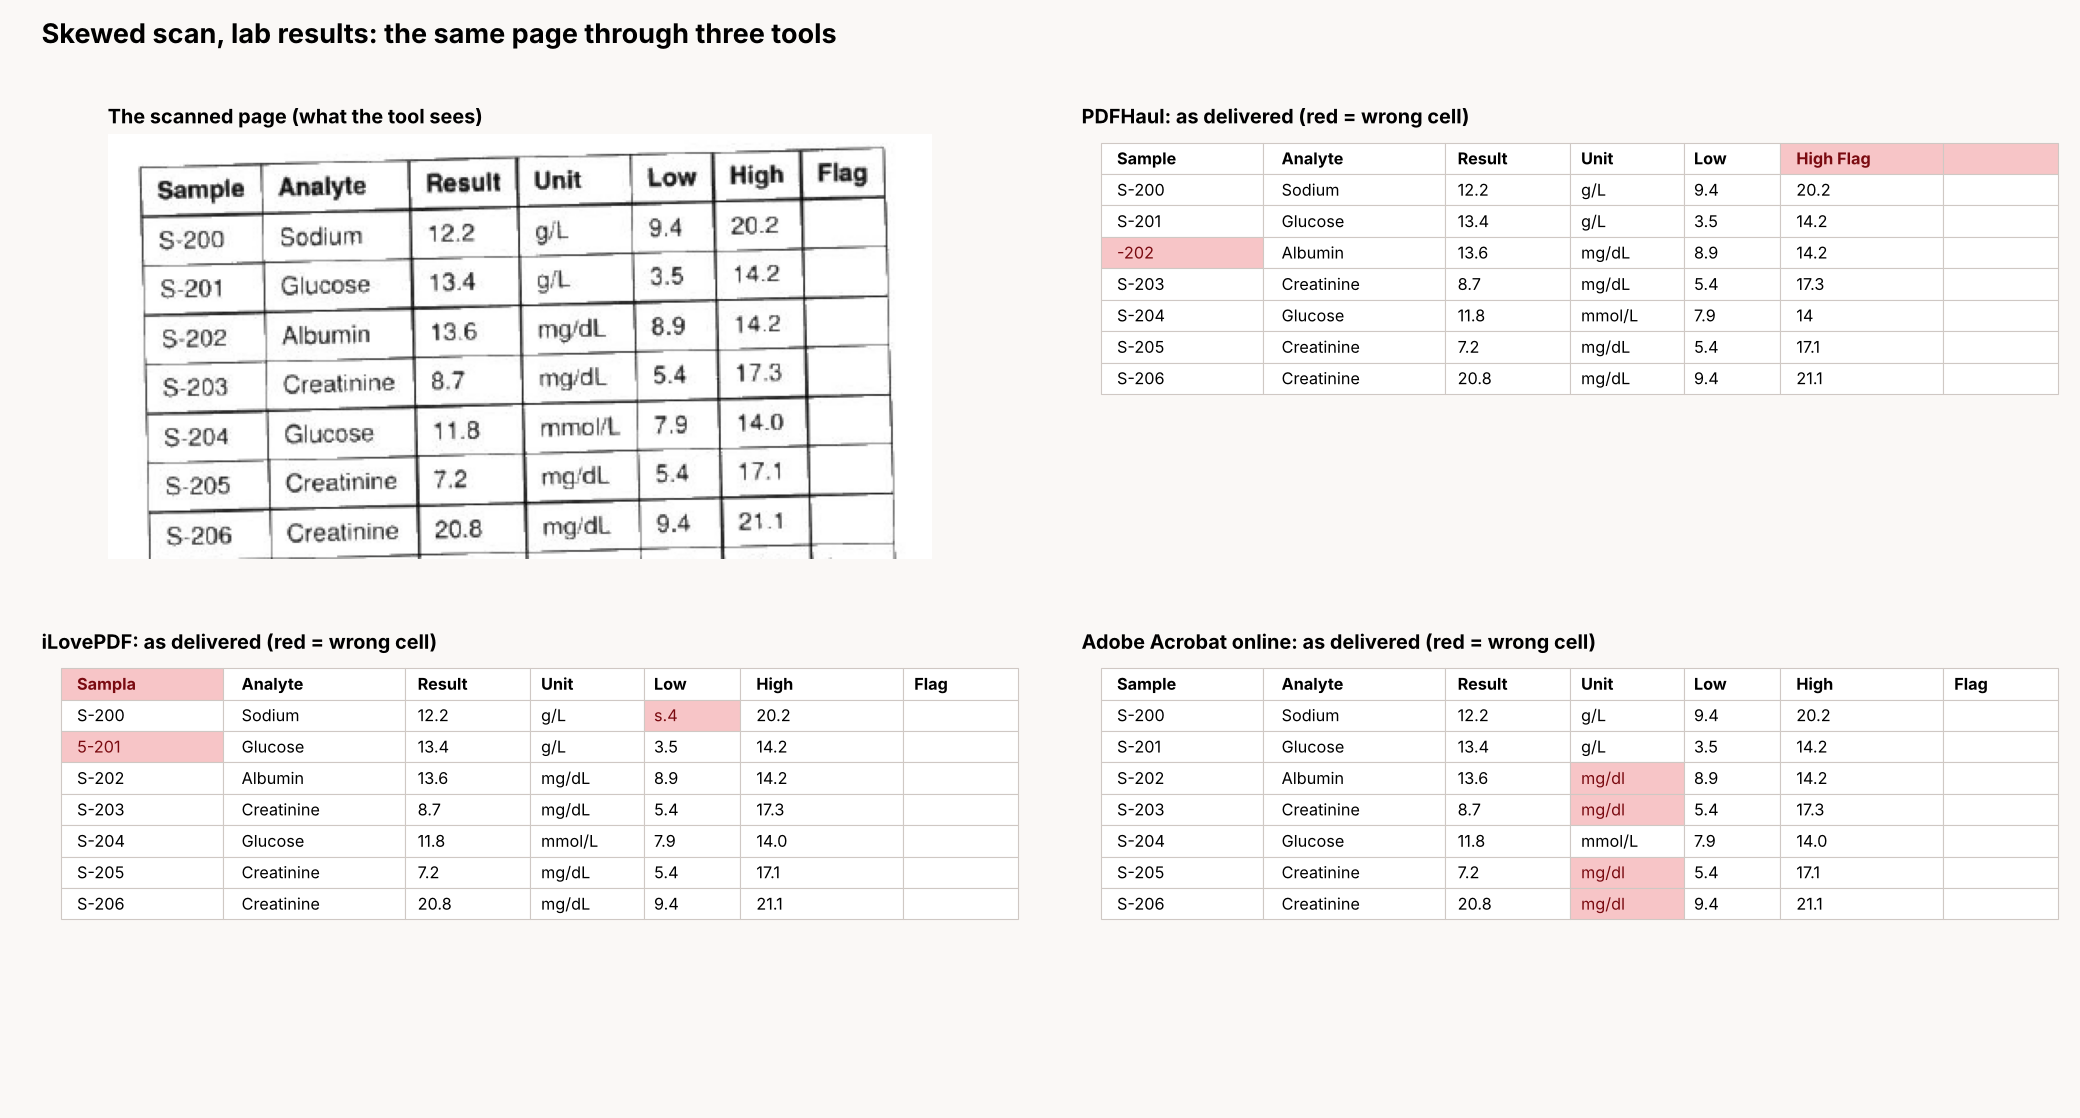
The misses are different for each tool, and they are the kind a quick look can miss:
iLovePDF read the digit 2 as the letter Z ("Z4" for 24, "INV-100Z"), read "Invoice" as "Involce", and added dollar signs to amounts.
Adobe wrote "mg/dl" for "mg/dL" and dropped the leading letter of codes, so "D07" became "7" and "B05" became "805".
PDFHaul merged the last column into the column before it on the skewed scan ("High Flag" in one cell, "16.3 L" in another), dropped the leading S from three sample IDs ("-202" for "S-202"), and on the dense scan ran words together ("WidgetAstd" for "Widget A std") and read "D07" as "DO7".
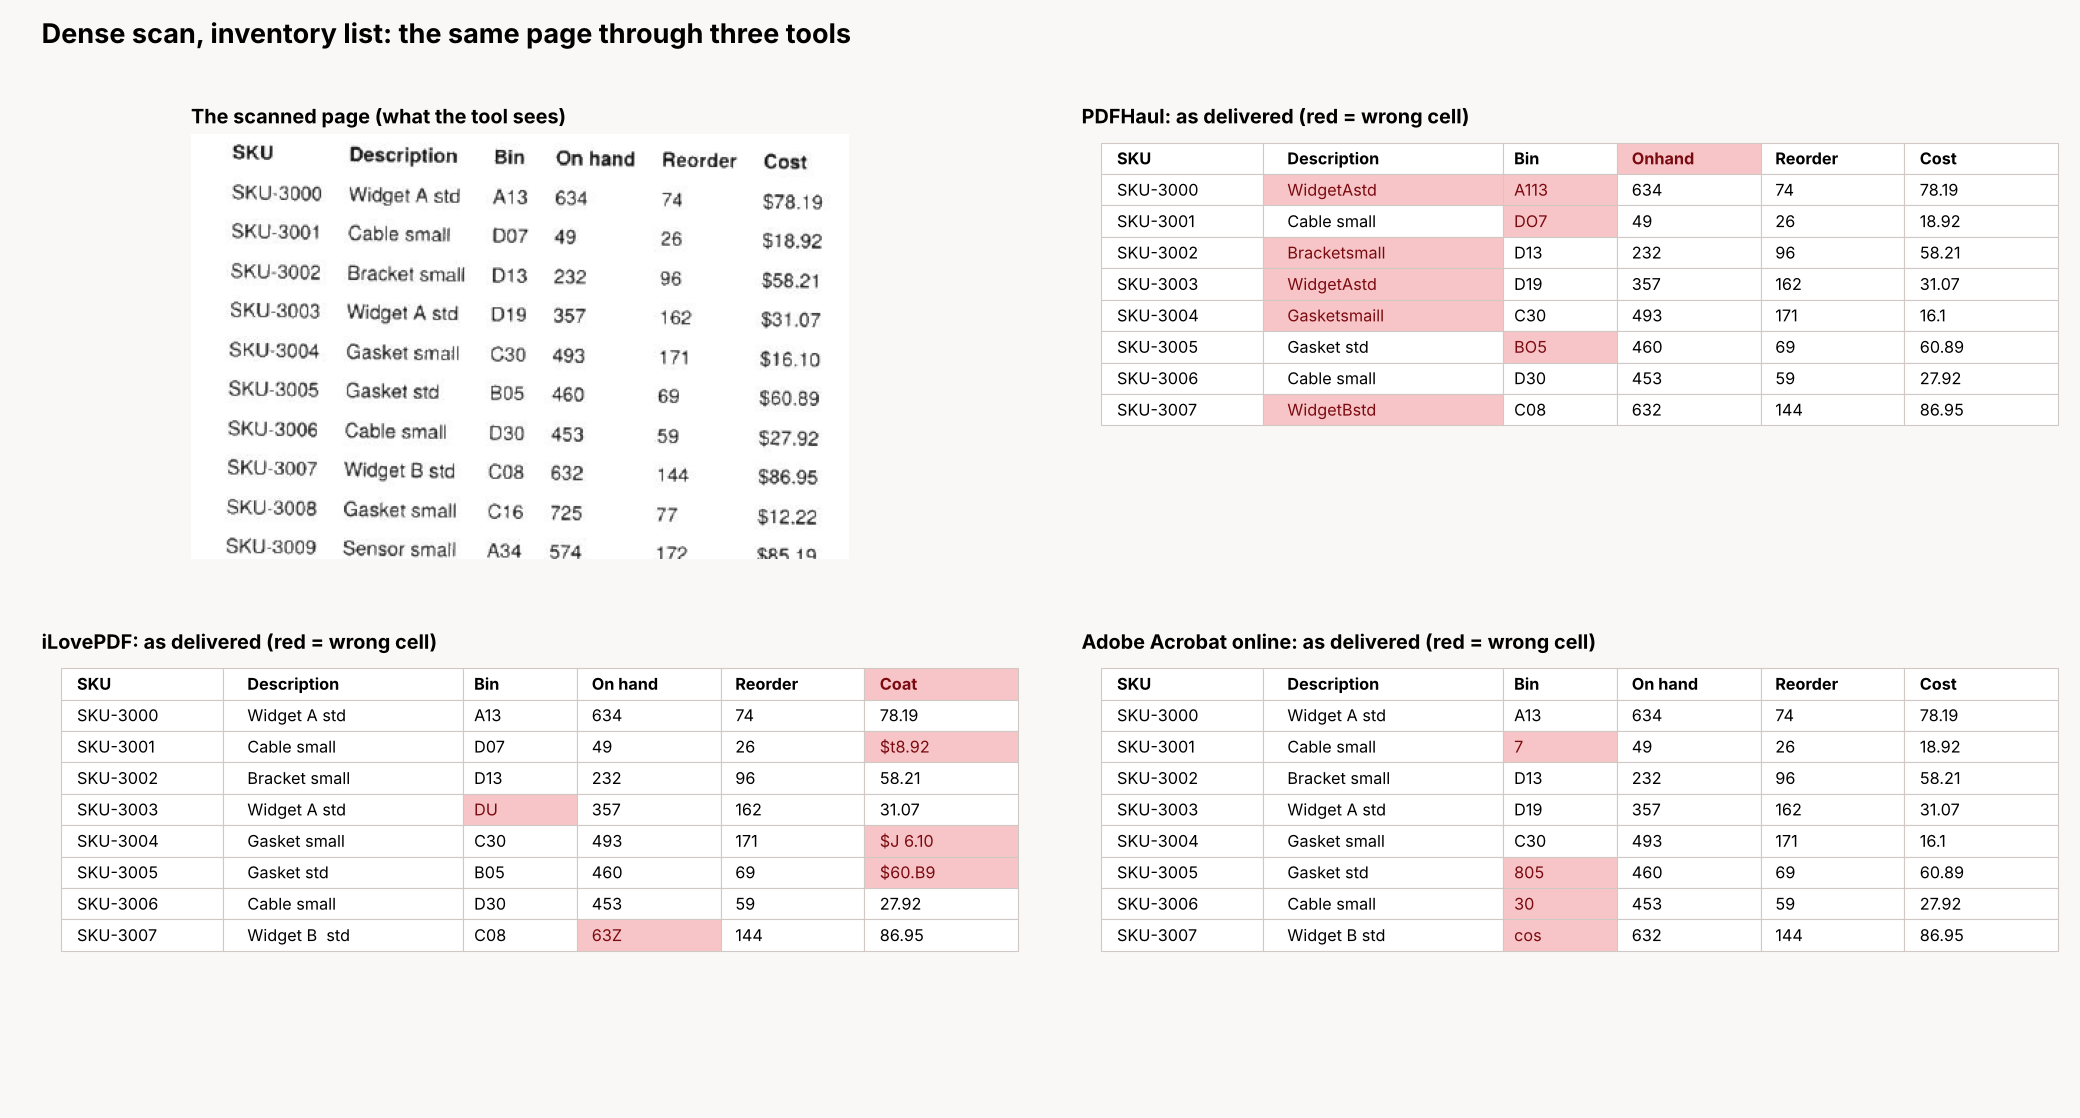
The honest summary for scans: OCR tools get most of the table, none of them gets all of it, and the errors are small enough to pass a glance. Check the numbers against the original before you use them.
Excel turned 14.2% into 0.142
Excel's Get Data turned a value like 14.2% into the number 0.142 in a cell with General formatting, so the cell shows 0.142 and the percent sign is gone. The value is correct mathematically, but the formatting is lost. Under our rule that percent cells are compared as displayed, those cells count as wrong. There are 117 of them across three files. If you count them as right, Excel scores 2,848 of 2,851 cells (99.9%) on the 16 files that are not scanned.
Both numbers are real, and which one matters depends on your use. The point is that a conversion can change how a value is typed or displayed, not only where it lands. Check your percentage columns after any import.
What to check after you convert a PDF
Every tool in this test made at least one mistake that a quick look would miss. Whatever tool you use, these are the checks that would have caught them:
Percentage columns. Look at how they display. A value that should read 14.2% can come out as 0.142.
Digits and letters. In scans, 2 became Z, 0 became O, and the leading letter of a code disappeared: "D07" turned into "DO7" and into "7", and "S-202" turned into "-202". Sort the ID column and look for codes that do not fit the pattern.
Decimal points and thousands separators. One tool turned 47573.24 into "$47.573.24", 3176 into "3.176" and 1130 into "1.13". PDFHaul turned 4.9 into 49. Compare a few numbers against the page.
Letter case in units. "mg/dL" came back as "mg/dl". It is a small thing until a lookup depends on it.
Header and title rows. Check the first rows. Excel inserted placeholder names (Column1, Column3, Column5) in blank header cells, and on the file with a title row, Tabula put each whole row into a single cell.
Columns that joined. A last column such as "Flag" can end up inside the cell next to it, which leaves the whole column empty.
Words run together. "Widget A std" became "WidgetAstd" on the dense scan. A column of descriptions is quick to scan for this.
Repeated headers. On a multi-page table, look for the header row again in the middle of the data.
A total you can check. If the PDF has a total, add the column and compare. One wrong digit shows up immediately.
Free-tier limits we hit
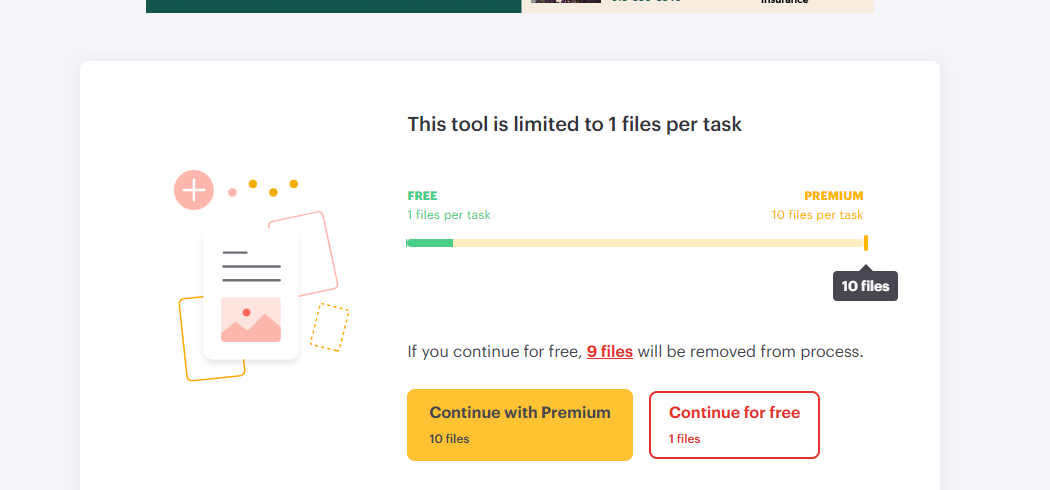
iLovePDF: the free plan converts one file per task, and ten on its paid plan. OCR is listed as a paid option. With it off, iLovePDF still returned editable cells from our image-only PDFs, with the errors above. We report that as observed, and we cannot explain it.
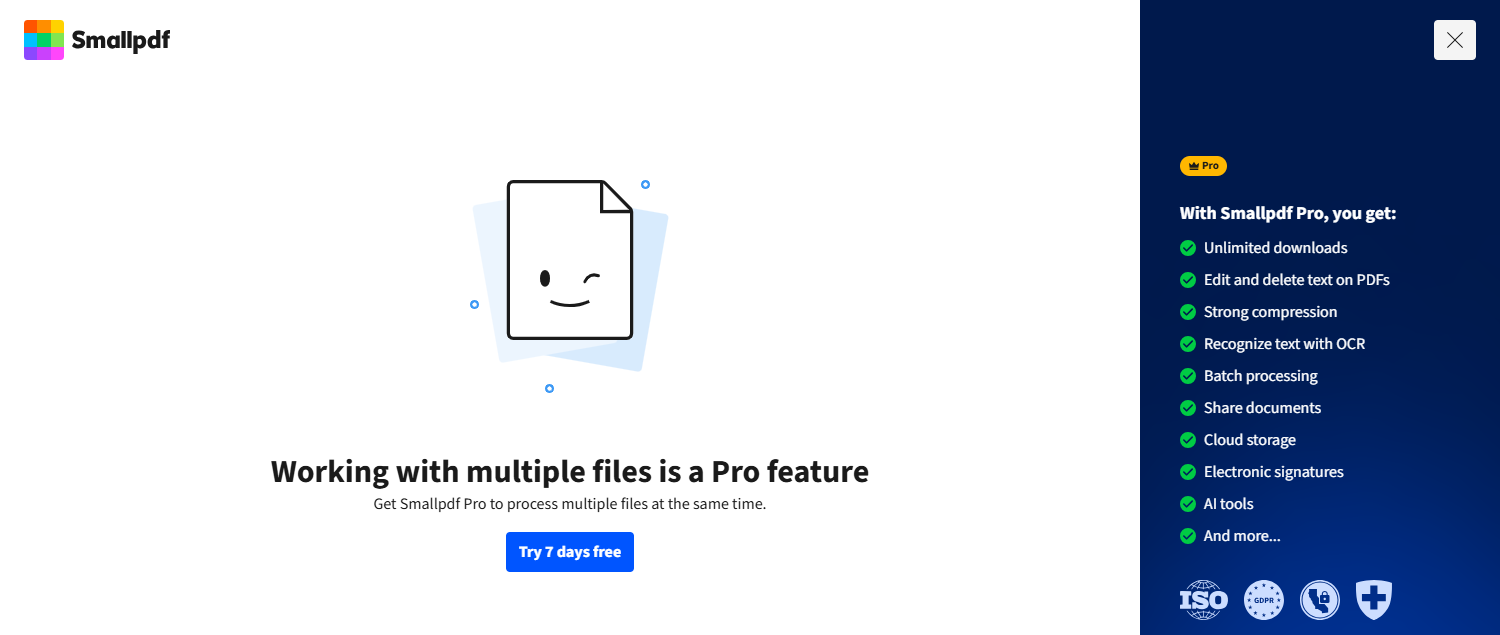
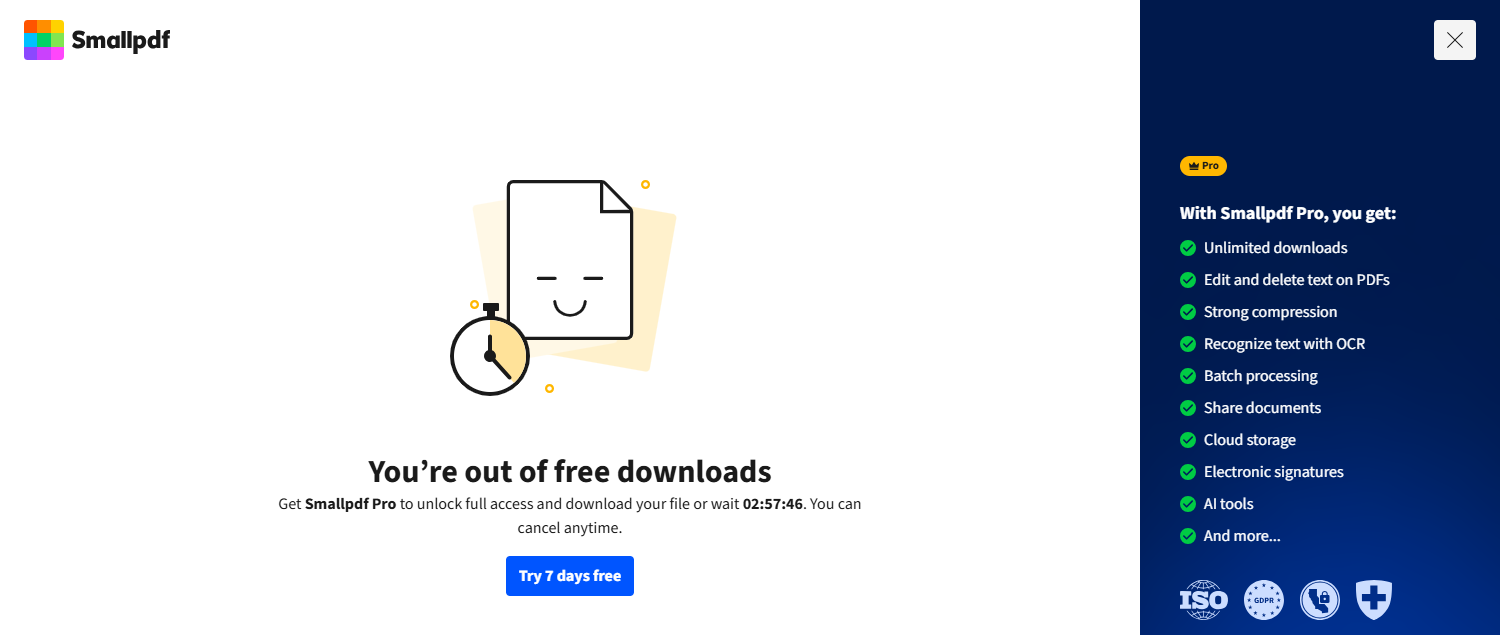
Smallpdf: converting several files at once is a Pro feature, and the free downloads ran out after two conversions, with a wait of about three hours. OCR is a Premium feature, which is why the scanned files came back as pictures.
Adobe Acrobat online: the free plan stopped after two conversions.
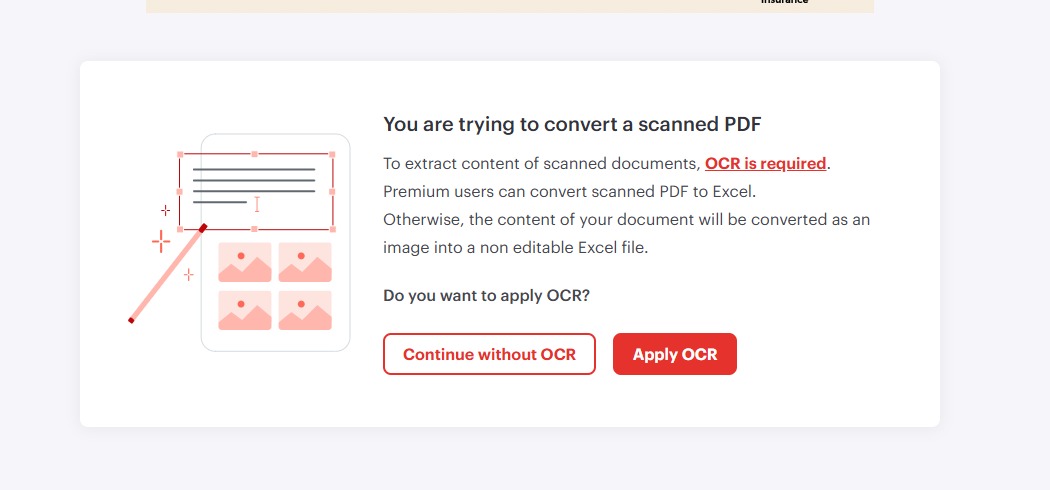
Free limits change, so check each site before you plan around them.
What we did not test
Real-world PDFs. Ours are clean synthetic files made for this test, and real documents are messier.
Password-protected files, very long tables, and languages other than English.
Speed. We did not time any tool.
Paid plans. Everything is the free version of a web tool or the default settings of a library.
Tools that produce Word or Google Docs files, since they output documents and not spreadsheets.
The files are synthetic on purpose, so that every cell has a known right answer. A different set of PDFs could give different numbers.
Download the files, the answer key and the raw results
Everything we used is in one download: the 20 PDFs, the answer key (one CSV per PDF), the scoring script, the raw results (every tool's score for every file, as a CSV), and a README with the steps to score your own tool.
Download the test files, answer key, scoring script and raw results (ZIP)
Which tool for which table
Clean tables with borders: use any of them. The tool will not change the result.
Tables without borders: avoid pdfplumber's default settings. The others handled them.
Merged cells: check the header and title rows in the output. That is where tools differed.
Tables over several pages: choose a tool that joins the pages for you, or stack the library output and drop the repeated headers.
Scanned pages: use a tool with OCR, and check every number against the original. In our test Adobe did best on the two hardest scans, and PDFHaul did best on the clean and the borderless scan.
If you want to try the two PDFHaul tools on your own file, PDF to Excel puts the page content on one sheet, and Extract Tables pulls out just the tables, one sheet each. Download the test files and score any tool you like against the same answer key.
Now we would like to hear from you. Which of the ten findings surprised you most? Is there a table type or a tool you would like us to test next? Leave a comment below.


